tick.dataset
This module provides easy access to some datasets used as benchmarks in tick.
These datasets are hosted on the following separate repository:
and are easily accessible using the following function:
|
Fetch dataset from tick_datasets github repository. |
Some datasets might also have a dedicated function handler if they need a dedicated treatment.
Load Hawkes formatted bund data from https://github.com/X-DataInitiative/tick-datasets/tree/master/hawkes/bund |
The following datasets are easily downloadable using fetch_tick_dataset
(for now, only for binary classification):
binary/adult/adult.trn.bz2(training) andbinary/adult/adult.tst.bz2(testing)binary/covtype/covtype.trn.bz2binary/ijcnn1/ijcnn1.trn.bz2(training) andbinary/ijcnn1/ijcnn1.tst.bz2(testing)binary/reuters/reuters.trn.bz2(training) andbinary/reuters/reuters.tst.bz2(testing)
Example
"""
==============================================
Binary classification with logistic regression
==============================================
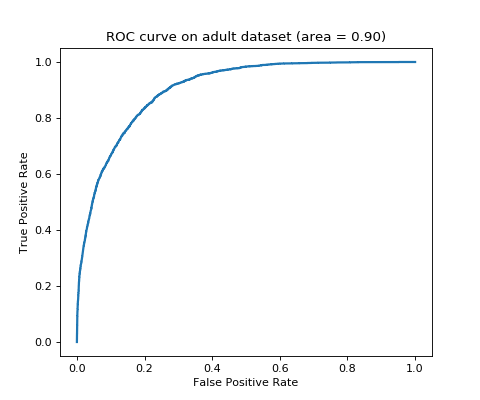
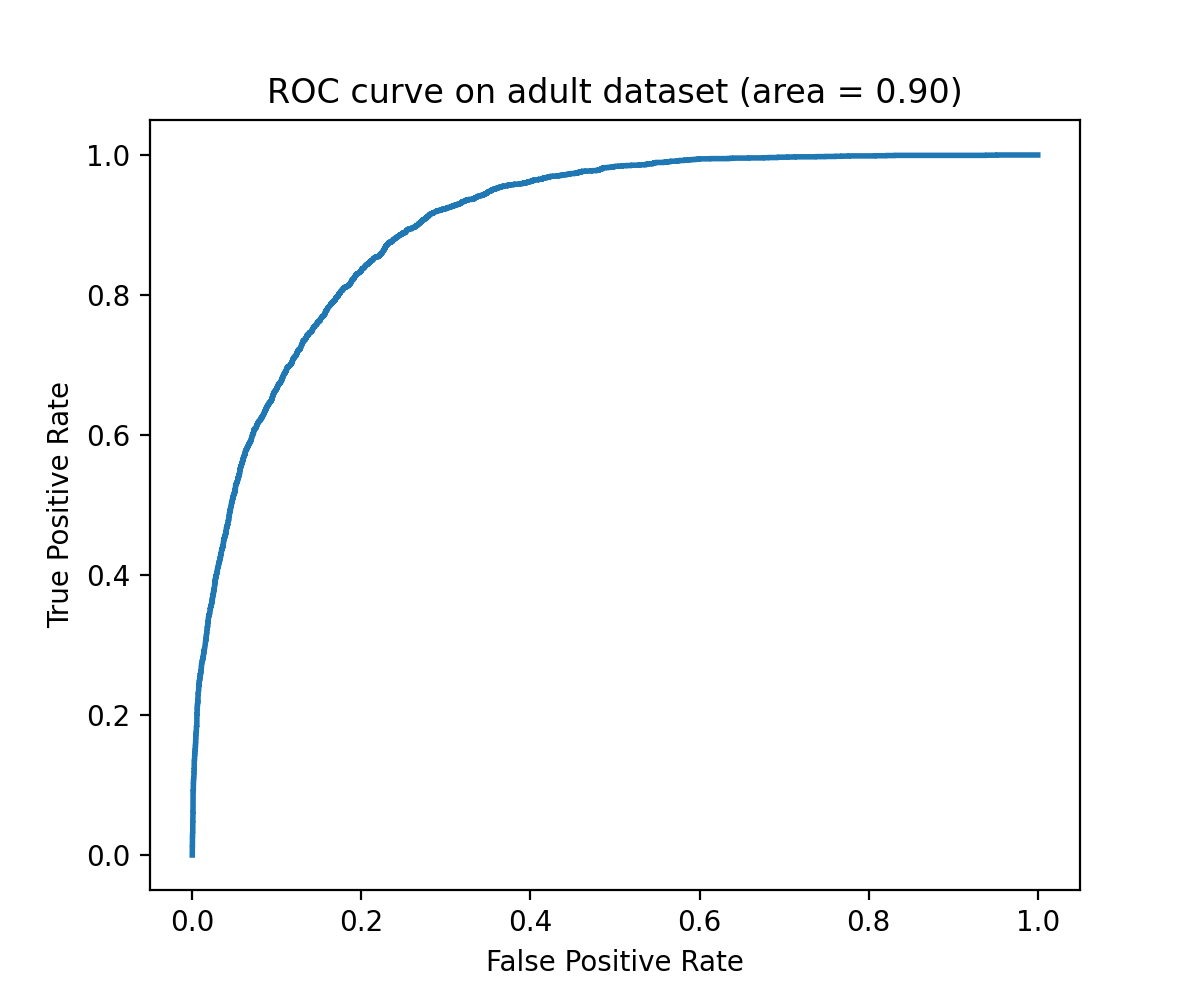
This code perform binary classification on adult dataset with logistic
regression learner (`tick.inference.LogisticRegression`).
"""
import matplotlib.pyplot as plt
from sklearn.metrics import roc_curve, auc
from tick.linear_model import LogisticRegression
from tick.dataset import fetch_tick_dataset
train_set = fetch_tick_dataset('binary/adult/adult.trn.bz2')
test_set = fetch_tick_dataset('binary/adult/adult.tst.bz2')
learner = LogisticRegression()
learner.fit(train_set[0], train_set[1])
predictions = learner.predict_proba(test_set[0])
fpr, tpr, _ = roc_curve(test_set[1], predictions[:, 1])
plt.figure(figsize=(6, 5))
plt.plot(fpr, tpr, lw=2)
plt.title("ROC curve on adult dataset (area = {:.2f})".format(auc(fpr, tpr)))
plt.ylabel("True Positive Rate")
plt.xlabel("False Positive Rate")
plt.show()
(Source code, png, hires.png, pdf)