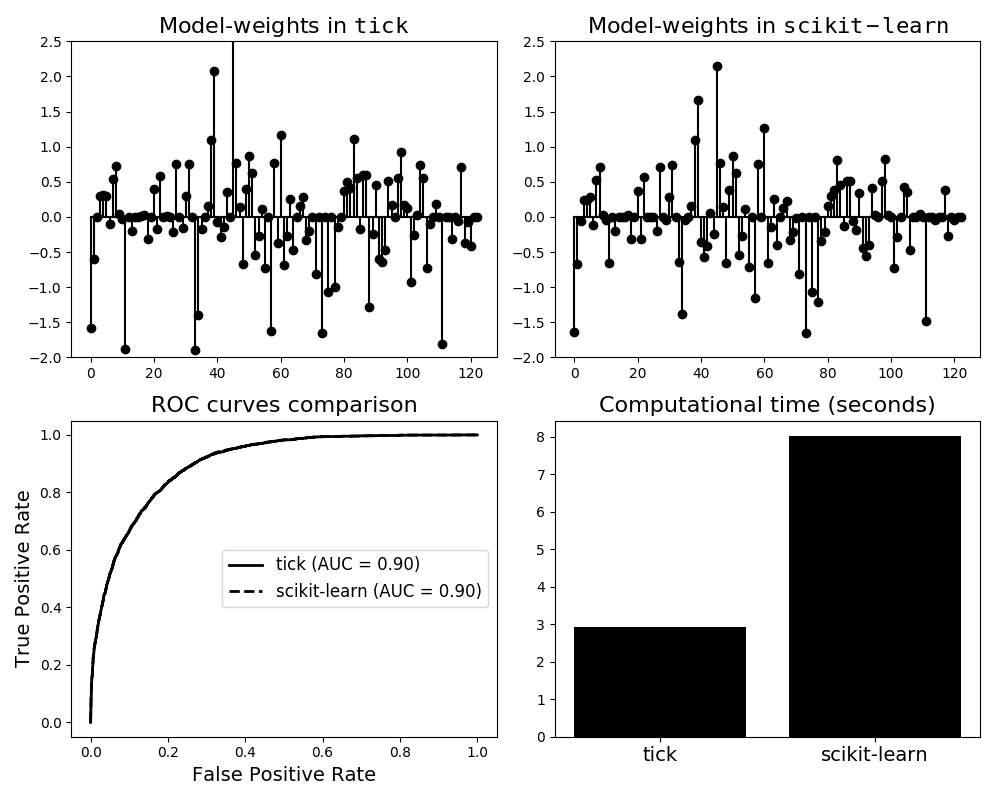
Logistic regression comparison: scikit-learn versus tick
In this example we give a naive comparison of tick and scikit-learn for
binary classification using logistic regression with \(\ell_1\)
penalization.
This comparison is done using the well-known adult dataset, a standard
benchmark dataset for binary clasification.
Some remarks are the following:
Both classifiers have the same performance in terms of AUC (area under the ROC curve)
Learned model-weights are slightly different. This is explained by the fact that
scikit-learnusesliblinearfor optimization of the \(\ell_1\)-penalized likelihood. When using this solver, theinterceptis penalized like the model weights (coeff_), while this is not the case intick. Note that this difference can be reduced by tuning theintercept_scalingparameter fromscikit-learn’sLogisticRegressionIn this example, the computational time of
tickis better thanscikit’s

Python source code: plot_logistic_tick_vs_scikit.py
import numpy as np
from time import time
import matplotlib.pyplot as plt

from sklearn.metrics import roc_curve, auc
from sklearn.linear_model import LogisticRegression as LogRegScikit

from tick.dataset import fetch_tick_dataset
from tick.linear_model import LogisticRegression as LogRegTick

train_set = fetch_tick_dataset('binary/adult/adult.trn.bz2')
test_set = fetch_tick_dataset('binary/adult/adult.tst.bz2')

clf_tick = LogRegTick(C=1e5, penalty='l1', tol=1e-8)
clf_scikit = LogRegScikit(penalty='l1', tol=1e-8)

t1 = time()
clf_tick.fit(train_set[0], train_set[1])
t_tick = time() - t1

t1 = time()
clf_scikit.fit(train_set[0], train_set[1])
t_scikit = time() - t1

pred_tick = clf_tick.predict_proba(test_set[0])
pred_scikit = clf_scikit.predict_proba(test_set[0])

fpr_tick, tpr_tick, _ = roc_curve(test_set[1], pred_tick[:, 1])
fpr_scikit, tpr_scikit, _ = roc_curve(test_set[1], pred_scikit[:, 1])

plt.figure(figsize=(10, 8))

ax1 = plt.subplot2grid((2, 2), (0, 0))
plt.stem(clf_tick.weights)
plt.title(r'Model-weights in $\mathtt{tick}$', fontsize=16)
plt.ylim((-2, 2.5))

ax2 = plt.subplot2grid((2, 2), (0, 1))
plt.stem(np.ravel(clf_scikit.coef_))
# plt.legend()
plt.ylim((-2, 2.5))
plt.title(r'Model-weights in $\mathtt{scikit-learn}$', fontsize=16)

plt.subplot2grid((2, 2), (1, 0))
plt.plot(fpr_tick, tpr_tick, lw=2)
plt.plot(fpr_scikit, tpr_scikit, lw=2)
plt.legend([
    "tick (AUC = {:.2f})".format(auc(fpr_tick, tpr_tick)),
    "scikit-learn (AUC = {:.2f})".format(auc(fpr_tick, tpr_tick))
], loc='center right', fontsize=12)
plt.ylabel("True Positive Rate", fontsize=14)
plt.xlabel("False Positive Rate", fontsize=14)
plt.title('ROC curves comparison', fontsize=16)

ax4 = plt.subplot2grid((2, 2), (1, 1))
plt.bar([1, 2], [t_tick, t_scikit])
ax4.set_xticks([1, 2])
ax4.set_xticklabels(['tick', 'scikit-learn'], fontsize=14)
plt.title('Computational time (seconds)', fontsize=16)

plt.tight_layout()
plt.show()
Total running time of the example: 11.95 seconds ( 0 minutes 11.95 seconds)
- Mentioned tick classes: