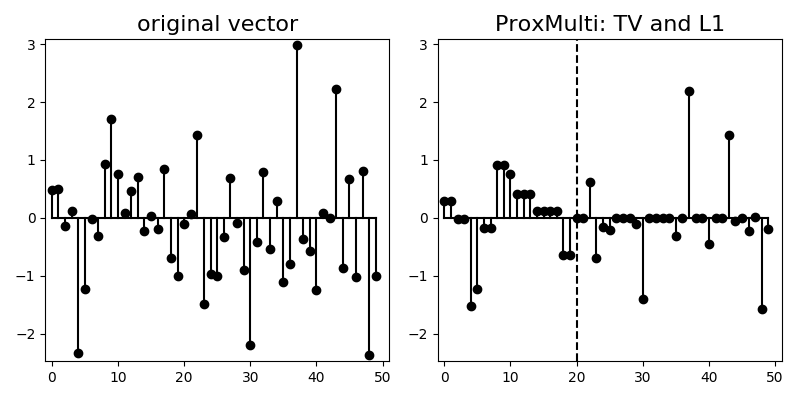
plot_prox_multi.py

Python source code: plot_prox_multi.py
import numpy as np
import matplotlib.pyplot as plt
from tick.prox import ProxL1, ProxTV, ProxMulti

s = 0.4

prox = ProxMulti(
    proxs=(
        ProxTV(strength=s, range=(0, 20)),
        ProxL1(strength=2 * s, range=(20, 50))
    )
)

x = np.random.randn(50)
a, b = x.min() - 1e-1, x.max() + 1e-1

plt.figure(figsize=(8, 4))
plt.subplot(1, 2, 1)
plt.stem(x)
plt.title("original vector", fontsize=16)
plt.xlim((-1, 51))
plt.ylim((a, b))
plt.subplot(1, 2, 2)
plt.stem(prox.call(x))
plt.title("ProxMulti: TV and L1", fontsize=16)
plt.xlim((-1, 51))
plt.ylim((a, b))
plt.vlines(20, a, b, linestyles='dashed')
plt.tight_layout()
plt.show()
Total running time of the example: 0.35 seconds ( 0 minutes 0.35 seconds)
- Mentioned tick classes: