plot_grad_coeff0.py
Python source code: plot_grad_coeff0.py
import numpy as np
import matplotlib.pyplot as plt
from tick.linear_model import ModelLogReg, SimuLogReg
from tick.simulation import weights_sparse_gauss
n_samples, n_features = 2000, 50
weights0 = weights_sparse_gauss(n_weights=n_features, nnz=10)
intercept0 = 1.
X, y = SimuLogReg(weights0, intercept=intercept0, seed=123,
n_samples=n_samples, verbose=False).simulate()
model = ModelLogReg(fit_intercept=True).fit(X, y)
coeffs0 = np.concatenate([weights0, [intercept0]])
_, ax = plt.subplots(1, 2, sharey=True, figsize=(9, 3))
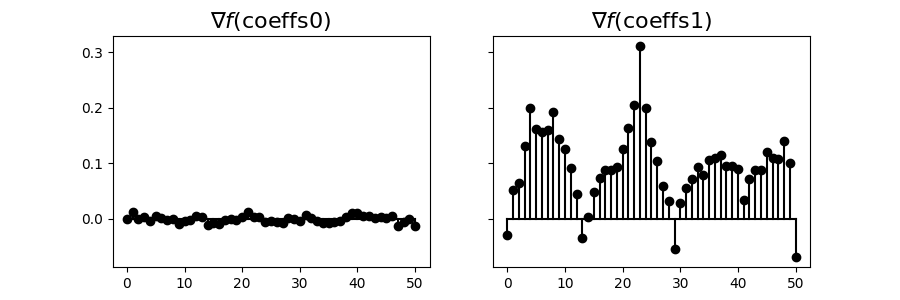
ax[0].stem(model.grad(coeffs0))
ax[0].set_title(r"$\nabla f(\mathrm{coeffs0})$", fontsize=16)
ax[1].stem(model.grad(np.ones(model.n_coeffs)))
ax[1].set_title(r"$\nabla f(\mathrm{coeffs1})$", fontsize=16)
plt.show()
Total running time of the example: 0.03 seconds ( 0 minutes 0.03 seconds)
- Mentioned tick classes: