Examples of proximal operators
Plot examples of proximal operators available in tick
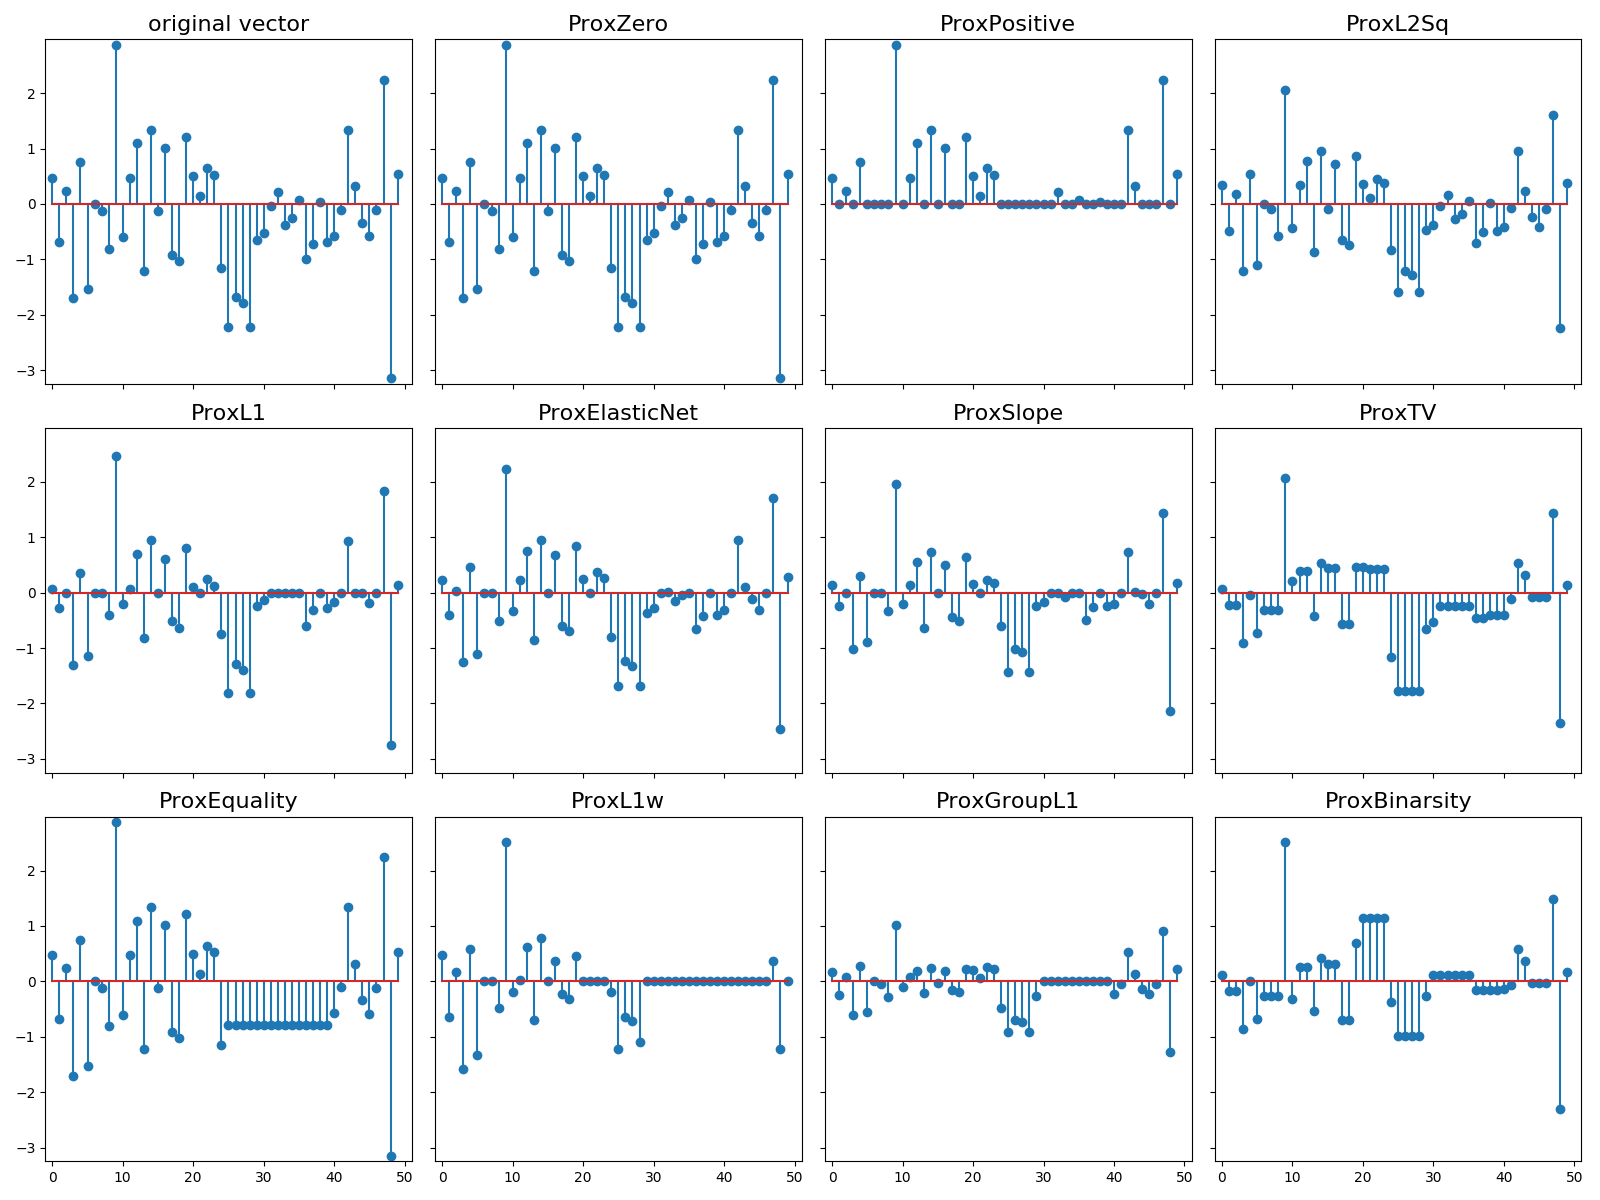
Python source code: plot_prox_example.py
import numpy as np
import matplotlib.pyplot as plt
from tick.prox import ProxL1, ProxElasticNet, ProxL2Sq, \
    ProxPositive, ProxSlope, ProxTV, ProxZero, ProxBinarsity, ProxGroupL1, \
    ProxEquality, ProxL1w

np.random.seed(12)
x = np.random.randn(50)
a, b = x.min() - 1e-1, x.max() + 1e-1
s = 0.4

proxs = [
    ProxZero(),
    ProxPositive(),
    ProxL2Sq(strength=s),
    ProxL1(strength=s),
    ProxElasticNet(strength=s, ratio=0.5),
    ProxSlope(strength=s),
    ProxTV(strength=s),
    ProxEquality(range=(25, 40)),
    ProxL1w(strength=s, weights=0.1 * np.arange(50, dtype=np.double)),
    ProxGroupL1(strength=2 * s, blocks_start=np.arange(0, 50, 10),
                blocks_length=10 * np.ones((5,))),
    ProxBinarsity(strength=s, blocks_start=np.arange(0, 50, 10),
                  blocks_length=10 * np.ones((5,)))
]

fig, _ = plt.subplots(3, 4, figsize=(16, 12), sharey=True, sharex=True)
fig.axes[0].stem(x)
fig.axes[0].set_title("original vector", fontsize=16)
fig.axes[0].set_xlim((-1, 51))
fig.axes[0].set_ylim((a, b))

for i, prox in enumerate(proxs):
    fig.axes[i + 1].stem(prox.call(x))
    fig.axes[i + 1].set_title(prox.name, fontsize=16)
    fig.axes[i + 1].set_xlim((-1, 51))
    fig.axes[i + 1].set_ylim((a, b))

plt.tight_layout()
plt.show()
Total running time of the example: 0.40 seconds ( 0 minutes 0.40 seconds)