tick.plot.plot_basis_kernels
- tick.plot.plot_basis_kernels(learner, support=None, basis_kernels=None, n_points=300, show=True)[source]
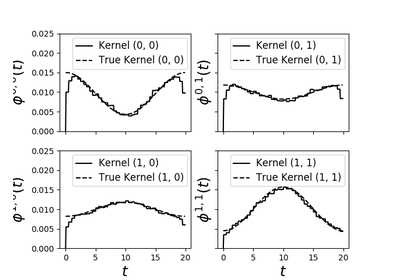
Function used to plot basis of kernels
It is used jointly with
tick.hawkes.inference.HawkesBasisKernelslearner class.- Parameters:
learner :
HawkesBasisKernelsThe given learner which basis kernels are plotted
support :
float, default=Nonethe size of the support that will be used to plot all the kernels. If None or non positive then the maximum kernel supports is used
basis_kernels :
listoffunc, default=NoneTrue basis kernels. If not
None, it will find the closest estimated basis kernel and will plot it together. This basis kernels will be normalized to fit better with their estimations.n_points :
int, default=300Number of points that will be used in abscissa. More points will lead to a more precise graph.
show :
bool, default=`True`if
True, show the plot. Otherwise an explicit call to the show function is necessary. Useful when superposing several plots.