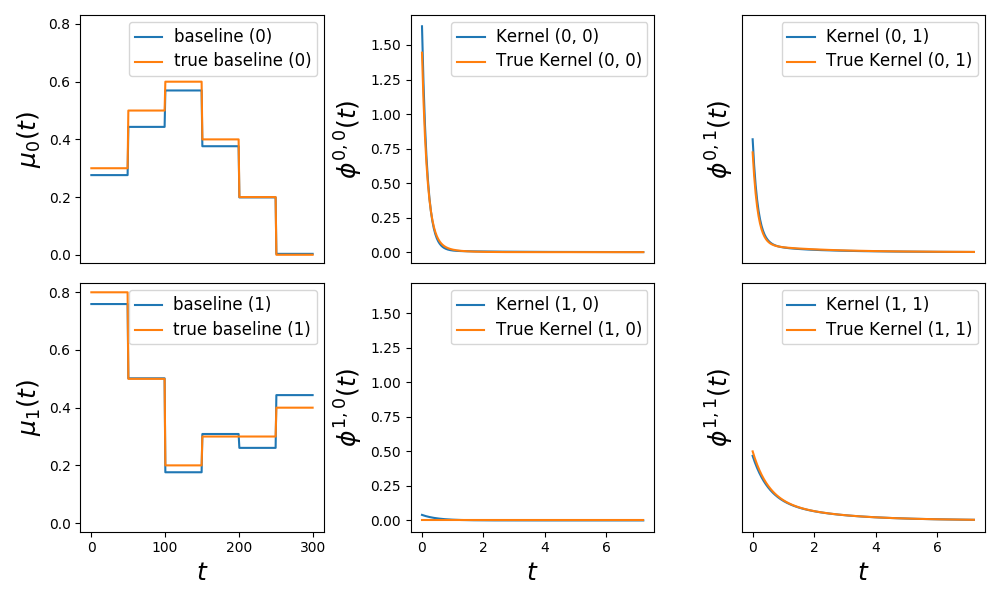
Hawkes process with non constant baseline
This example simulates and then estimates Hawkes kernels with varying baselines. In this example the intensity is written the following way
\(\lambda_i(t) = \mu_i(t) + \sum_{j=1}^D \int \phi_{ij}(t - s)dN_j(s)\)
Kernels are sum of exponentials and varying baseline \(\mu_i(t)\) piecewise constant.

Python source code: plot_hawkes_varying_baseline.py
import matplotlib.pyplot as plt

from tick.plot import plot_hawkes_baseline_and_kernels
from tick.hawkes import (SimuHawkesSumExpKernels, SimuHawkesMulti,
                         HawkesSumExpKern)

period_length = 300
baselines = [[0.3, 0.5, 0.6, 0.4, 0.2, 0], [0.8, 0.5, 0.2, 0.3, 0.3, 0.4]]
n_baselines = len(baselines[0])
decays = [.5, 2., 6.]
adjacency = [[[0, .1, .4], [.2, 0., .2]], [[0, 0, 0], [.6, .3, 0]]]

# simulation
hawkes = SimuHawkesSumExpKernels(baseline=baselines,
                                 period_length=period_length, decays=decays,
                                 adjacency=adjacency, seed=2093, verbose=False)
hawkes.end_time = 1000
hawkes.adjust_spectral_radius(0.5)

multi = SimuHawkesMulti(hawkes, n_simulations=4)
multi.simulate()

# estimation
learner = HawkesSumExpKern(decays=decays, n_baselines=n_baselines,
                           period_length=period_length)

learner.fit(multi.timestamps)

# plot
fig = plot_hawkes_baseline_and_kernels(learner, hawkes=hawkes, show=False)
fig.tight_layout()

plt.show()
Total running time of the example: 0.43 seconds ( 0 minutes 0.43 seconds)
- Mentioned tick classes:
tick.plot.plot_hawkes_baseline_and_kernels