Inhomogeneous Poisson process simulation
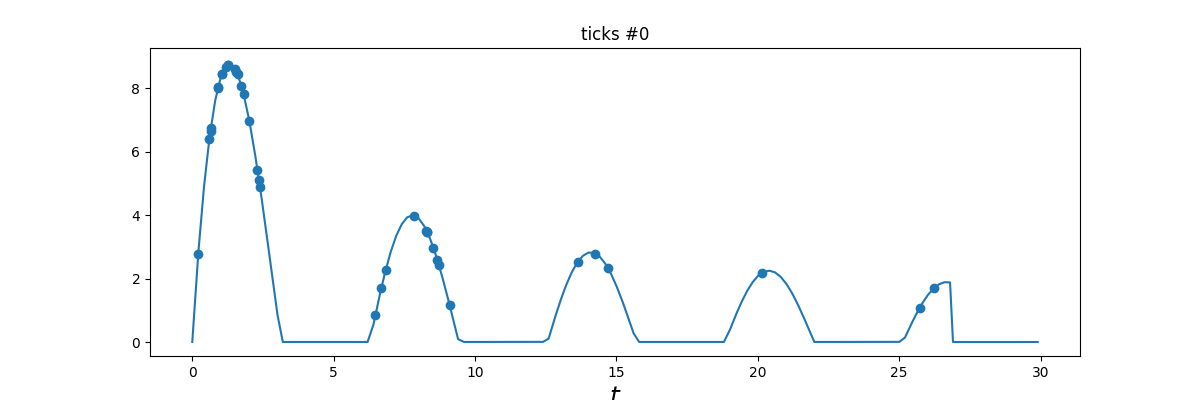
This example show how to simulate any inhomogeneous Poisson process. Its
intensity is modeled through tick.base.TimeFunction
Python source code: plot_poisson_inhomogeneous.py
import numpy as np
from tick.base import TimeFunction

from tick.plot import plot_point_process
from tick.hawkes import SimuInhomogeneousPoisson

run_time = 30

T = np.arange((run_time * 0.9) * 5, dtype=float) / 5
Y = np.maximum(
    15 * np.sin(T) * (np.divide(np.ones_like(T),
                                np.sqrt(T + 1) + 0.1 * T)), 0.001)

tf = TimeFunction((T, Y), dt=0.01)

# We define a 1 dimensional inhomogeneous Poisson process with the
# intensity function seen above
in_poi = SimuInhomogeneousPoisson([tf], end_time=run_time, verbose=False)

# We activate intensity tracking and launch simulation
in_poi.track_intensity(0.1)
in_poi.simulate()

# We plot the resulting inhomogeneous Poisson process with its
# intensity and its ticks over time
plot_point_process(in_poi)
Total running time of the example: 0.01 seconds ( 0 minutes 0.01 seconds)
- Mentioned tick classes: