tick.plot.plot_point_process
- tick.plot.plot_point_process(point_process, plot_intensity=None, n_points=10000, plot_nodes=None, node_names=None, t_min=None, t_max=None, max_jumps=None, show=True, ax=None)[source]
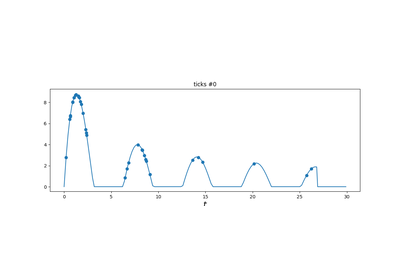
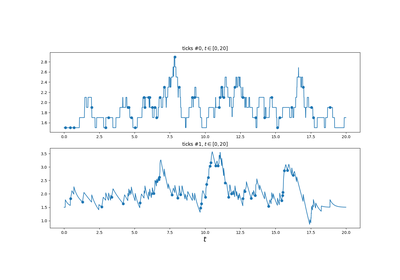
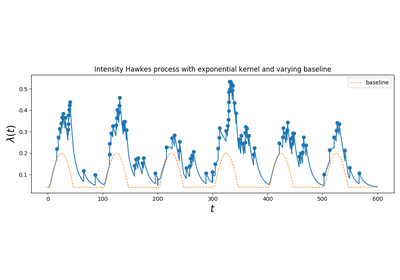
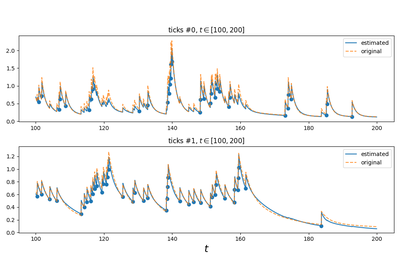
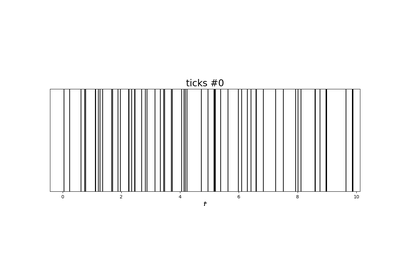
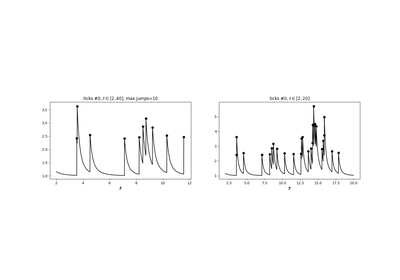
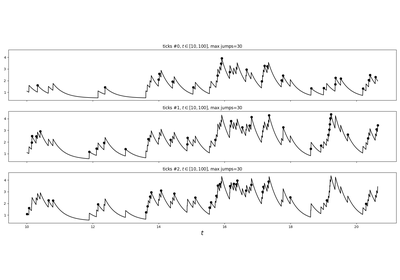
Plot point process realization
- Parameters:
point_process :
SimuPointProcessPoint process that will be plotted
plot_intensity :
bool, default=`None`Flag saying if intensity should be plotted. If
None, intensity will be plotted if it has been tracked.n_points :
int, default=10000Number of points used for intensity plot.
plot_nodes :
listofint, default=`None`List of nodes that will be plotted. If
None, all nodes are considerednode_names :
listofstr, default=`None`List of node names. If
None, node indices are used.t_min :
float, default=`None`If not
None, time at which plot will startt_max :
float, default=`None`If not
None, time at which plot will stopmax_jumps :
int, default=`None`If not
None, maximum of jumps per coordinate that will be plotted. This is useful when plotting big point processes to ensure a only readable part of them will be plottedshow :
bool, default=`True`if
True, show the plot. Otherwise an explicit call to the show function is necessary. Useful when superposing several plots.ax :
listofmatplotlib.axes, default=NoneIf not None, the figure will be plot on this axis and show will be set to False.