Robust linear model example
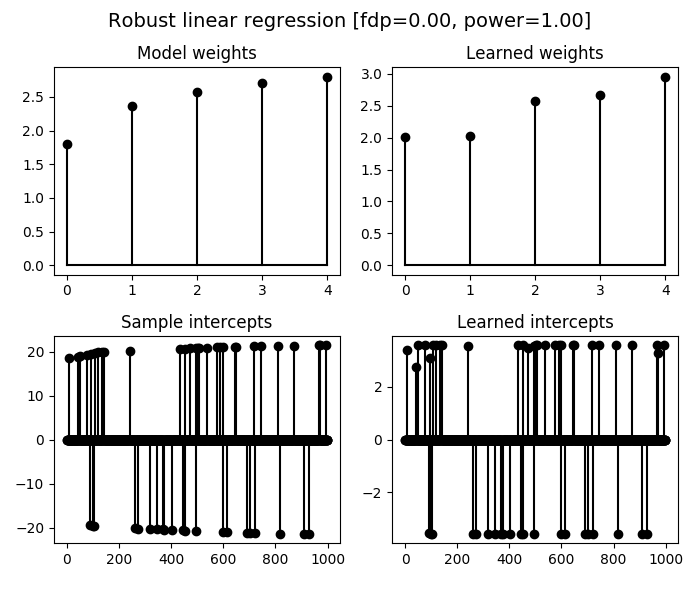
In this example with simulate a linear regression model with 1000 samples and 5 features. The simulated data is contaminated by 20% of outliers, in the form of sparse sample intercepts (thus only on 20% of samples).
We illustrate the estimated linear regression weights and sample intercepts
obtained by the RobustLinearRegression learner, where we also compute the
false discovery proportion and power of the method for the multi-test problem of
outliers detection.
Note that the penalization level C_sample_intercepts of the sample
intercepts should be chosen as n_samples / noise_level, where noise_level is
obtained by a robust estimation of the noise’s standard deviation.
We simply use here the tick.inference.std_iqr estimator.
Note that we don’t use penalization on the model weights here, while other
penalizations are available, by changing the penalty parameter and by
giving a C value for the level of penalization.
Default is penalty='l2', namely ridge penalization, while penalty='l1'
or penalty='slope' can be used when the number of features is large.
Python source code: plot_robust_linear_regression.py
import numpy as np
from matplotlib import pyplot as plt
from tick.simulation import weights_sparse_gauss, \
    features_normal_cov_toeplitz
from tick.robust import RobustLinearRegression, std_iqr
from tick.metrics import support_fdp, support_recall

np.random.seed(1)

n_samples = 1000
n_features = 5
noise_level = 1.
n_outliers = 50
outliers_intensity = 5.

intercept0 = -3.
log_linspace = np.log(n_features * np.linspace(1, 10, n_features))
weights0 = np.sqrt(2 * log_linspace)

sample_intercepts0 = weights_sparse_gauss(n_weights=n_samples, nnz=n_outliers)
idx_nnz = sample_intercepts0 != 0
log_linspace = np.log(n_samples * np.linspace(1, 10, n_outliers))
sample_intercepts0[idx_nnz] = outliers_intensity * np.sqrt(2 * log_linspace) \
    * np.sign(sample_intercepts0[idx_nnz])

X = features_normal_cov_toeplitz(n_samples, n_features, 0.5)

y = X.dot(weights0) + noise_level * np.random.randn(n_samples) \
    + intercept0 + sample_intercepts0

target_fdr = 0.1
noise_level = std_iqr(y)
learner = RobustLinearRegression(
    C_sample_intercepts=2 * n_samples / noise_level, penalty='none',
    fdr=target_fdr, verbose=False)
learner.fit(X, y)

fdp_ = support_fdp(sample_intercepts0, learner.sample_intercepts)
power_ = support_recall(sample_intercepts0, learner.sample_intercepts)

fig = plt.figure(figsize=(7, 6))
titles = [
    'Model weights', 'Learned weights', 'Sample intercepts',
    'Learned intercepts'
]
vectors = [
    weights0, learner.weights, sample_intercepts0, learner.sample_intercepts
]
for idx_plot, title, vector in zip(range(221, 225), titles, vectors):
    ax = fig.add_subplot(idx_plot)
    ax.stem(vector)
    ax.set_title(title, fontsize=12)
fig.suptitle(
    'Robust linear regression [fdp=%.2f, power=%.2f]' % (fdp_, power_),
    fontsize=14)
fig.tight_layout(rect=[0, 0.03, 1, 0.95])
plt.show()
Total running time of the example: 0.27 seconds ( 0 minutes 0.27 seconds)