plot_time_function.py
Python source code: plot_time_function.py
import matplotlib.pyplot as plt
import numpy as np
from tick.base import TimeFunction
from tick.plot import plot_timefunction
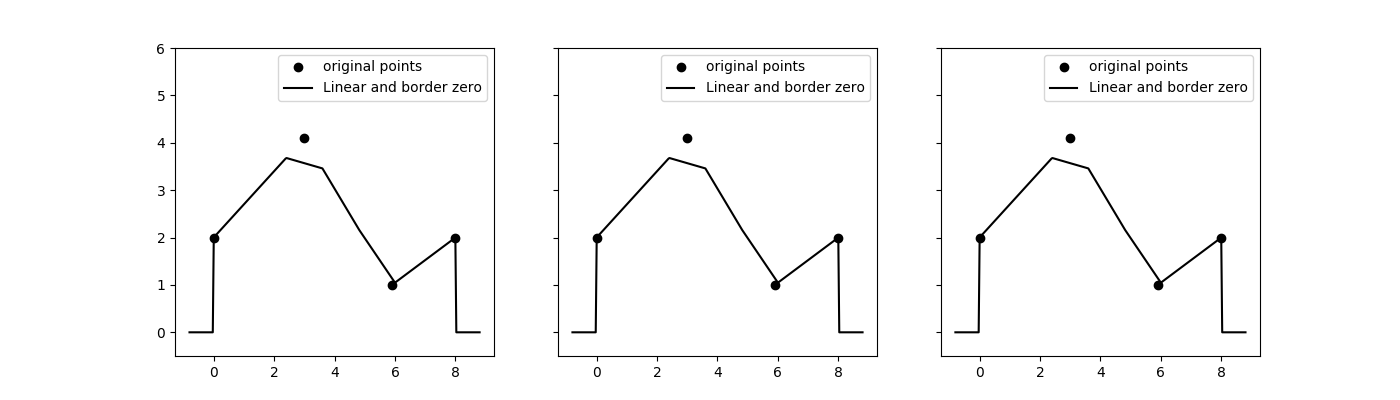
T = np.array([0, 3, 5.9, 8.001], dtype=float)
Y = np.array([2, 4.1, 1, 2], dtype=float)
tf_1 = TimeFunction((T, Y), dt=1.2)
tf_2 = TimeFunction((T, Y), border_type=TimeFunction.BorderContinue,
inter_mode=TimeFunction.InterConstRight, dt=0.01)
tf_3 = TimeFunction((T, Y), border_type=TimeFunction.BorderConstant,
inter_mode=TimeFunction.InterConstLeft, border_value=3)
time_functions = [tf_1, tf_2, tf_3]
_, ax_list = plt.subplots(1, 3, figsize=(14, 4), sharey=True)
for tf, ax in zip(time_functions, ax_list):
plot_timefunction(tf, ax=ax)
ax.set_ylim([-0.5, 6.0])
plt.show()
Total running time of the example: 0.02 seconds ( 0 minutes 0.02 seconds)
- Mentioned tick classes:
tick.base.TimeFunction.BorderConstanttick.base.TimeFunction.BorderContinuetick.base.TimeFunction.InterConstLefttick.base.TimeFunction.InterConstRight