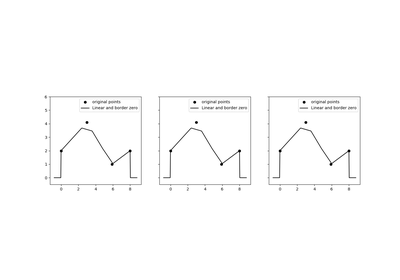
tick.plot.plot_timefunction
-
tick.plot.plot_timefunction(time_function, labels=None, n_points=300, show=True, ax=None)[source]¶ Quick plot of a
tick.base.TimeFunction- Parameters
time_function :
TimeFunctionThe
TimeFunctionthat will be plottedlabels :
listofstr, default=NoneLabels that will be given to the plot. If None, labels will be automatically generated.
n_points :
int, default=300Number of points that will be used in abscissa. More points will lead to a more precise graph.
show :
bool, default=`True`if
True, show the plot. Otherwise an explicit call to the show function is necessary. Useful when superposing several plots.ax :
matplotlib.axes, default=NoneIf not None, the figure will be plot on this axis and show will be set to False.
