tick.plot.plot_hawkes_kernel_norms
- tick.plot.plot_hawkes_kernel_norms(kernel_object, show=True, pcolor_kwargs=None, node_names=None, rotate_x_labels=0.0)[source]
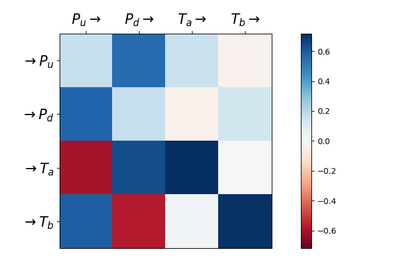
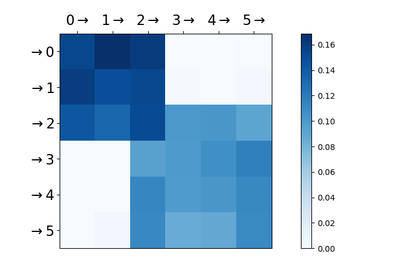
Generic function to plot Hawkes kernel norms.
- Parameters:
kernel_object :
ObjectAn object that must have the following API :
kernel_object.n_nodes: a field that stores the number of nodes of the associated Hawkes process (thus the number of kernels is this number squared)kernel_object.get_kernel_norms(): must return a 2d numpy array with the norm of each kernel
show :
bool, default=`True`if
True, show the plot. Otherwise an explicit call to the show function is necessary. Useful when superposing several plots.pcolor_kwargs :
dict, default=`None`Extra pcolor kwargs such as cmap, vmin, vmax
node_names :
listofstr, shape=(n_nodes, ), default=`None`node names that will be displayed on axis. If
None, node index will be used.rotate_x_labels :
float, default=`0.`Number of degrees to rotate the x-labels clockwise, to prevent overlapping.
Notes
Kernels are displayed such that it shows norm of column influence’s on row.