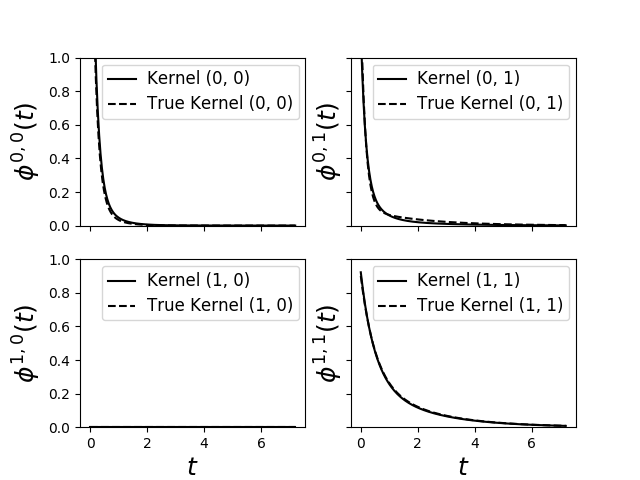
plot_hawkes_sum_exp_kernels.py
Python source code: plot_hawkes_sum_exp_kernels.py
import matplotlib.pyplot as plt

from tick.plot import plot_hawkes_kernels
from tick.hawkes import SimuHawkesSumExpKernels, SimuHawkesMulti, \
    HawkesSumExpKern

end_time = 1000
n_realizations = 10

decays = [.5, 2., 6.]
baseline = [0.12, 0.07]
adjacency = [[[0, .1, .4], [.2, 0., .2]],
             [[0, 0, 0], [.6, .3, 0]]]

hawkes_exp_kernels = SimuHawkesSumExpKernels(
    adjacency=adjacency, decays=decays, baseline=baseline,
    end_time=end_time, verbose=False, seed=1039)

multi = SimuHawkesMulti(hawkes_exp_kernels, n_simulations=n_realizations)

multi.end_time = [(i + 1) / 10 * end_time for i in range(n_realizations)]
multi.simulate()

learner = HawkesSumExpKern(decays, penalty='elasticnet',
                           elastic_net_ratio=0.8)
learner.fit(multi.timestamps)

fig = plot_hawkes_kernels(learner, hawkes=hawkes_exp_kernels, show=False)

for ax in fig.axes:
    ax.set_ylim([0., 1.])
Total running time of the example: 0.10 seconds ( 0 minutes 0.10 seconds)