tick.plot.plot_hawkes_kernels
- tick.plot.plot_hawkes_kernels(kernel_object, support=None, hawkes=None, n_points=300, show=True, log_scale=False, min_support=0.0001, ax=None)[source]
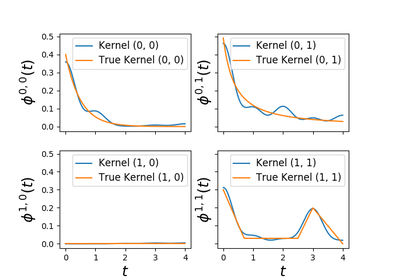
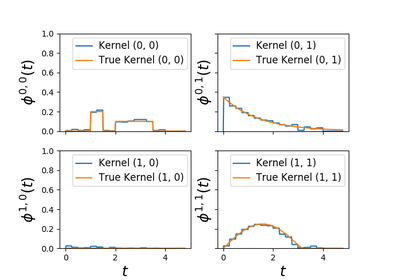
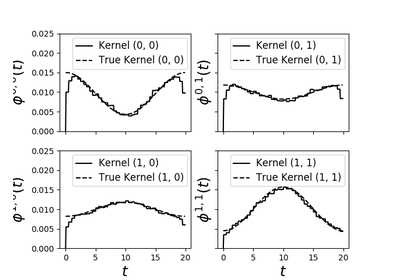
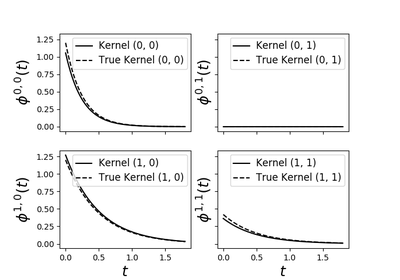
Generic function to plot Hawkes kernels.
- Parameters:
kernel_object :
ObjectAn object that must have the following API :
kernel_object.n_nodes: a field that stores the number of nodes of the associated Hawkes process (thus the number of kernels is this number squared)kernel_object.get_kernel_supports(): must return a 2d numpy array with the size of the support of each kernelkernel_object.get_kernel_values(self, i, j, abscissa_array): must return as a numpy 1d array the sampled(i,j)kernel values corresponding to the abscissaabscissa_array
support :
float, default=Nonethe size of the support that will be used to plot all the kernels. If None or non positive then the maximum kernel supports is used
hawkes :
SimuHawkes, default=NoneIf a
SimuHawkesobject is given then the kernels plots are superposed with those of this object (considered as theTruekernels). This is used to plot on the same plots the estimated kernels along with the true kernels.n_points :
int, default=300Number of points that will be used in abscissa. More points will lead to a more precise graph.
show :
bool, default=`True`if
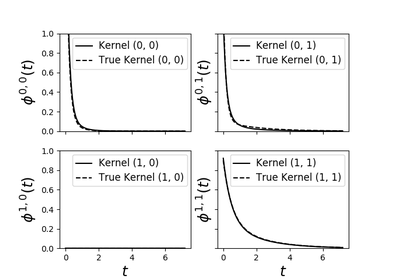
True, show the plot. Otherwise an explicit call to the show function is necessary. Useful when superposing several plots.log_scale :
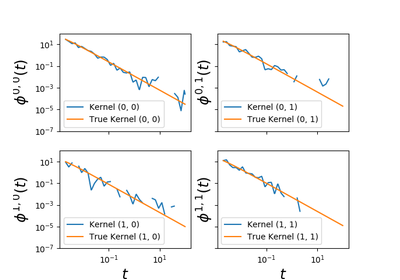
bool, default=`False`If
True, then x-axis and y-axis are on a log-scale. This is useful to plot power-law kernels.min_support :
float, default=1e-4Start value of the plot. Only used if log_scale is
True.ax :
np.ndarrayofmatplotlib.axes, default=NoneIf not None, the figure will be plot on these axes and show will be set to False.