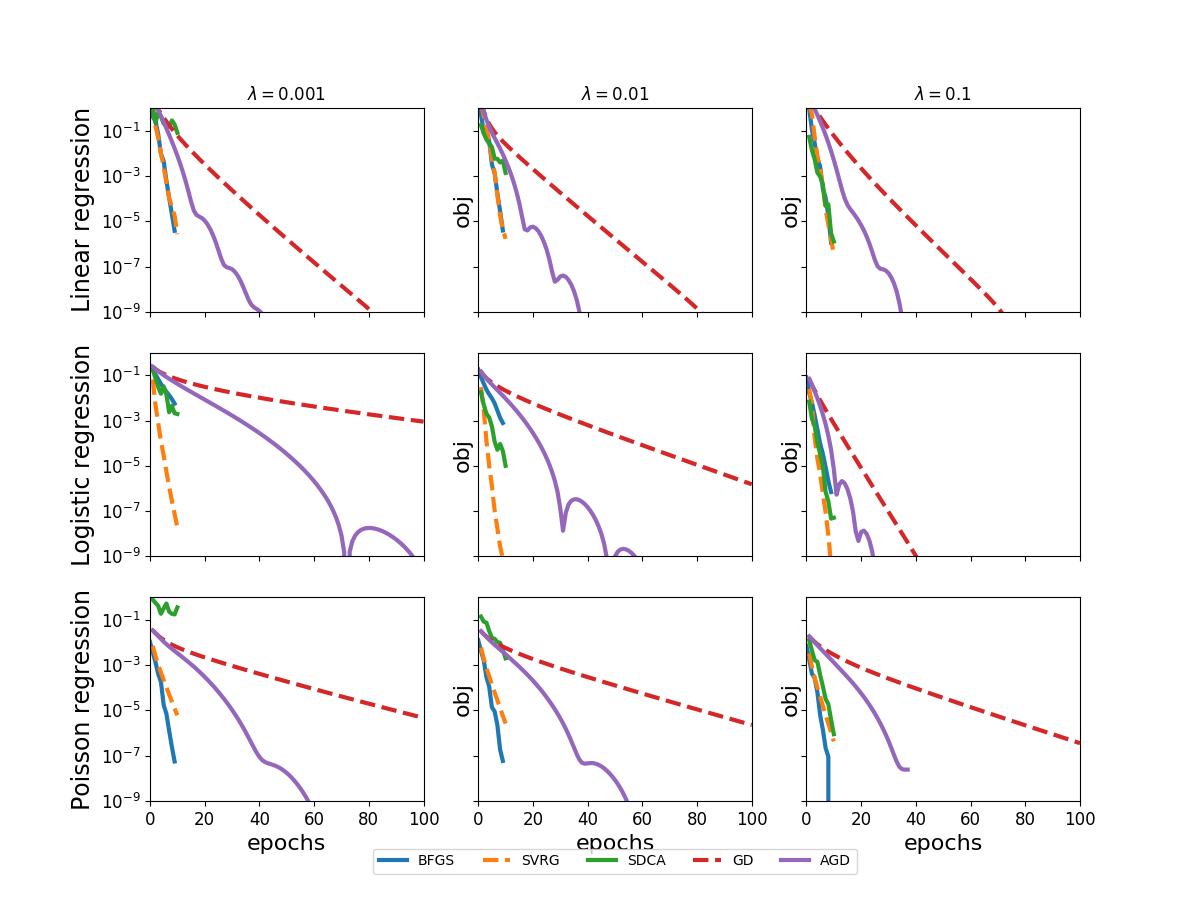
Generalized linear models solver convergence
- This example illustrates the optimization of three linear models:
Linear regression (
tick.optim.model.ModelLinReg)Logistic regression (
tick.optim.model.ModelLogReg)Poisson regression (
tick.optim.model.ModelPoisReg)
- with five different solvers:
LBFGS (
tick.solver.BFGS)SVRG (
tick.solver.SVRG)SDCA (
tick.solver.SDCA)GD (
tick.solver.GD)AGD (
tick.solver.AGD)
Python source code: plot_glm_convergence.py
import matplotlib.pyplot as plt
from tick.plot import plot_history
import numpy as np
from itertools import product
from tick.linear_model import SimuLinReg, SimuLogReg, SimuPoisReg, \
    ModelLinReg, ModelLogReg, ModelPoisReg
from tick.solver import SDCA, SVRG, BFGS, GD, AGD
from tick.prox import ProxZero, ProxL2Sq

seed = 1398
np.random.seed(seed)


def create_model(model_type, n_samples, n_features, with_intercept=True):
    weights = np.random.randn(n_features)
    intercept = None
    if with_intercept:
        intercept = np.random.normal()

    if model_type == 'Poisson':
        # we need to rescale features to avoid overflows
        weights /= n_features
        if intercept is not None:
            intercept /= n_features

    if model_type == 'Linear':
        simulator = SimuLinReg(weights, intercept=intercept,
                               n_samples=n_samples, verbose=False)
    elif model_type == 'Logistic':
        simulator = SimuLogReg(weights, intercept=intercept,
                               n_samples=n_samples, verbose=False)
    elif model_type == 'Poisson':
        simulator = SimuPoisReg(weights, intercept=intercept,
                                n_samples=n_samples, verbose=False)

    labels, features = simulator.simulate()

    if model_type == 'Linear':
        model = ModelLinReg(fit_intercept=with_intercept)
    elif model_type == 'Logistic':
        model = ModelLogReg(fit_intercept=with_intercept)
    elif model_type == 'Poisson':
        model = ModelPoisReg(fit_intercept=with_intercept)

    model.fit(labels, features)
    return model


def run_solvers(model, l_l2sq):
    try:
        svrg_step = 1. / model.get_lip_max()
    except AttributeError:
        svrg_step = 1e-3
    try:
        gd_step = 1. / model.get_lip_best()
    except AttributeError:
        gd_step = 1e-1

    bfgs = BFGS(verbose=False, tol=1e-13)
    bfgs.set_model(model).set_prox(ProxL2Sq(l_l2sq))
    bfgs.solve()
    bfgs.history.set_minimizer(bfgs.solution)
    bfgs.history.set_minimum(bfgs.objective(bfgs.solution))
    bfgs.solve()

    svrg = SVRG(step=svrg_step, verbose=False, tol=1e-10, seed=seed)
    svrg.set_model(model).set_prox(ProxL2Sq(l_l2sq))
    svrg.history.set_minimizer(bfgs.solution)
    svrg.history.set_minimum(bfgs.objective(bfgs.solution))
    svrg.solve()

    sdca = SDCA(l_l2sq, verbose=False, seed=seed, tol=1e-10)
    sdca.set_model(model).set_prox(ProxZero())
    sdca.history.set_minimizer(bfgs.solution)
    sdca.history.set_minimum(bfgs.objective(bfgs.solution))
    sdca.solve()

    gd = GD(verbose=False, tol=1e-10, step=gd_step, linesearch=False)
    gd.set_model(model).set_prox(ProxL2Sq(l_l2sq))
    gd.history.set_minimizer(bfgs.solution)
    gd.history.set_minimum(bfgs.objective(bfgs.solution))
    gd.solve()

    agd = AGD(verbose=False, tol=1e-10, step=gd_step, linesearch=False)
    agd.set_model(model).set_prox(ProxL2Sq(l_l2sq))
    agd.history.set_minimizer(bfgs.solution)
    agd.history.set_minimum(bfgs.objective(bfgs.solution))
    agd.solve()

    return bfgs, svrg, sdca, gd, agd


model_types = ['Linear', 'Logistic', 'Poisson']
l_l2sqs = [1e-3, 1e-2, 1e-1]

fig, axes = plt.subplots(
    len(model_types), len(l_l2sqs),
    figsize=(4 * len(l_l2sqs), 3 * len(model_types)), sharey=True, sharex=True)

n_samples = 1000
n_features = 20

for (model_type, l_l2sq), ax in zip(
        product(model_types, l_l2sqs), axes.ravel()):
    model = create_model(model_type, n_samples, n_features)

    bfgs, svrg, sdca, gd, agd = run_solvers(model, l_l2sq)
    plot_history([bfgs, svrg, sdca, gd, agd], ax=ax, dist_min=True,
                 log_scale=True)
    ax.legend_.remove()
    ax.set_xlabel('')
    ax.set_ylim([1e-9, 1])

for l_l2sq, ax in zip(l_l2sqs, axes[0]):
    ax.set_title('$\lambda = %.2g$' % l_l2sq)

for model_type, ax in zip(model_types, axes):
    ax[0].set_ylabel('%s regression' % model_type, fontsize=17)

for ax in axes[-1]:
    ax.set_xlabel('epochs')

axes[-1][1].legend(loc=9, bbox_to_anchor=(0.5, -0.2), ncol=5)
plt.show()
Total running time of the example: 1.02 seconds ( 0 minutes 1.02 seconds)
- Mentioned tick classes: